# Understanding efficacy
Sleuth provides an option on both the Project Metrics and Team Metrics dashboards to view the install dates for your installed automations within the context of your metrics, allowing you to see at a glance whether those automations are having the intended impact!
Viewing automation install dates within the context of DORA metrics
To view the install dates for installed automations within the Project Metrics or Team Metrics dashboards, perform the following steps:
* Select a specific Project or Team from the **Switch to** menu. \

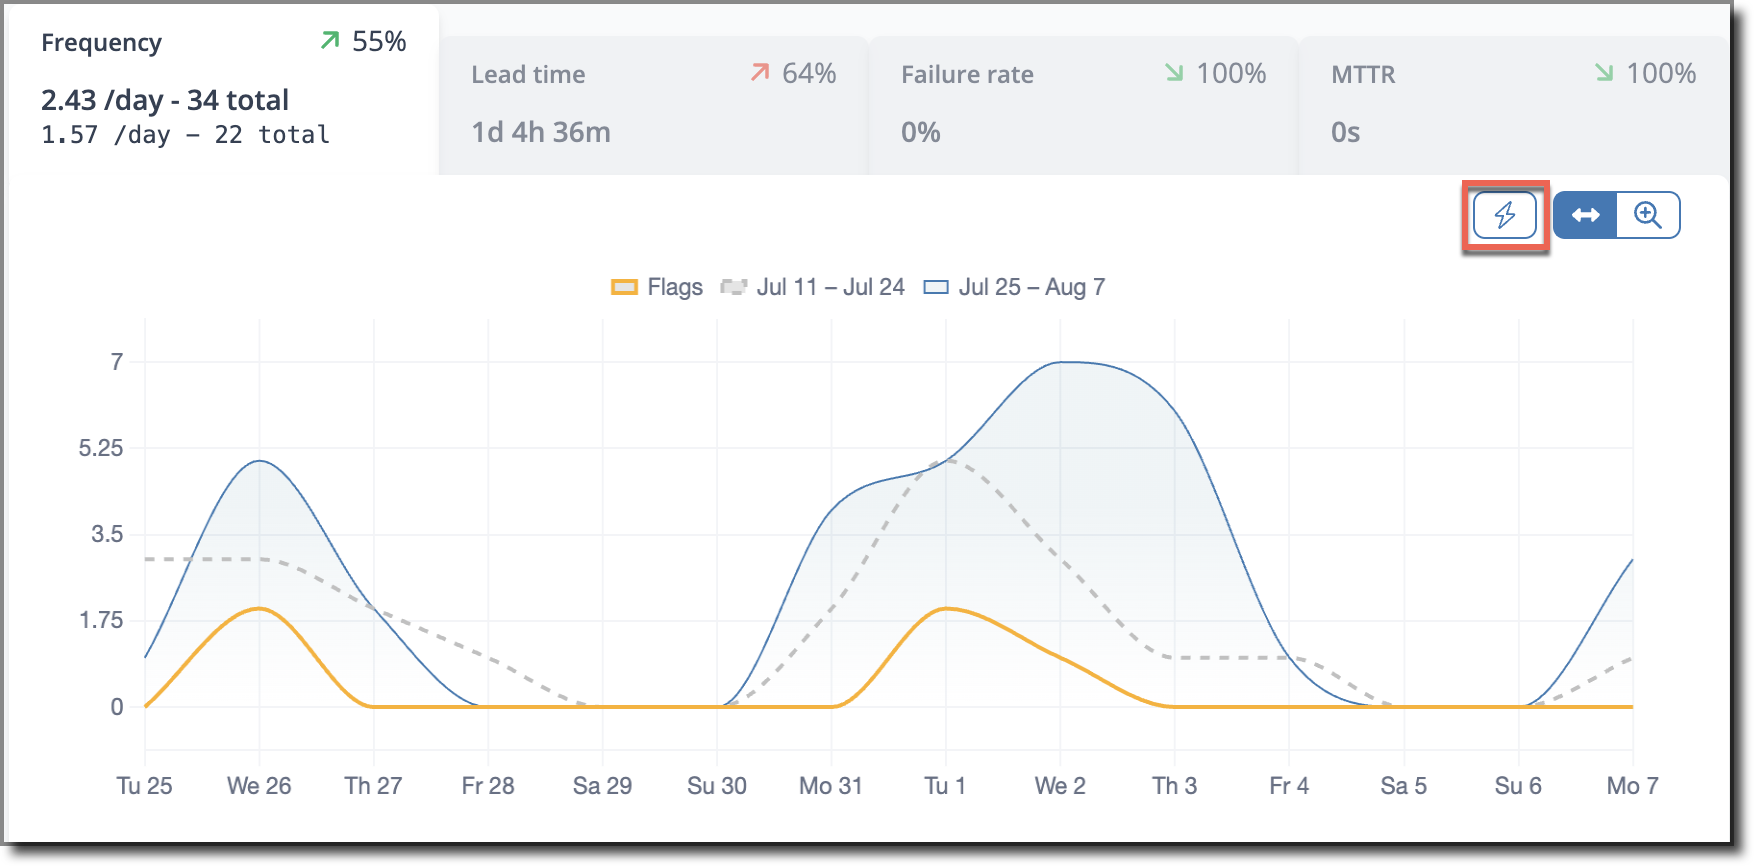
* Click the lightning bolt icon to display automation install dates on the chart.
NOTE: If you don't see the lightning bolt icon, it's likely because you have no automations installed for the current Project/Team. To install an automation, refer to [Installing automations](https://help.sleuth.io/sleuth-automations/automations-marketplace/installing-automations).
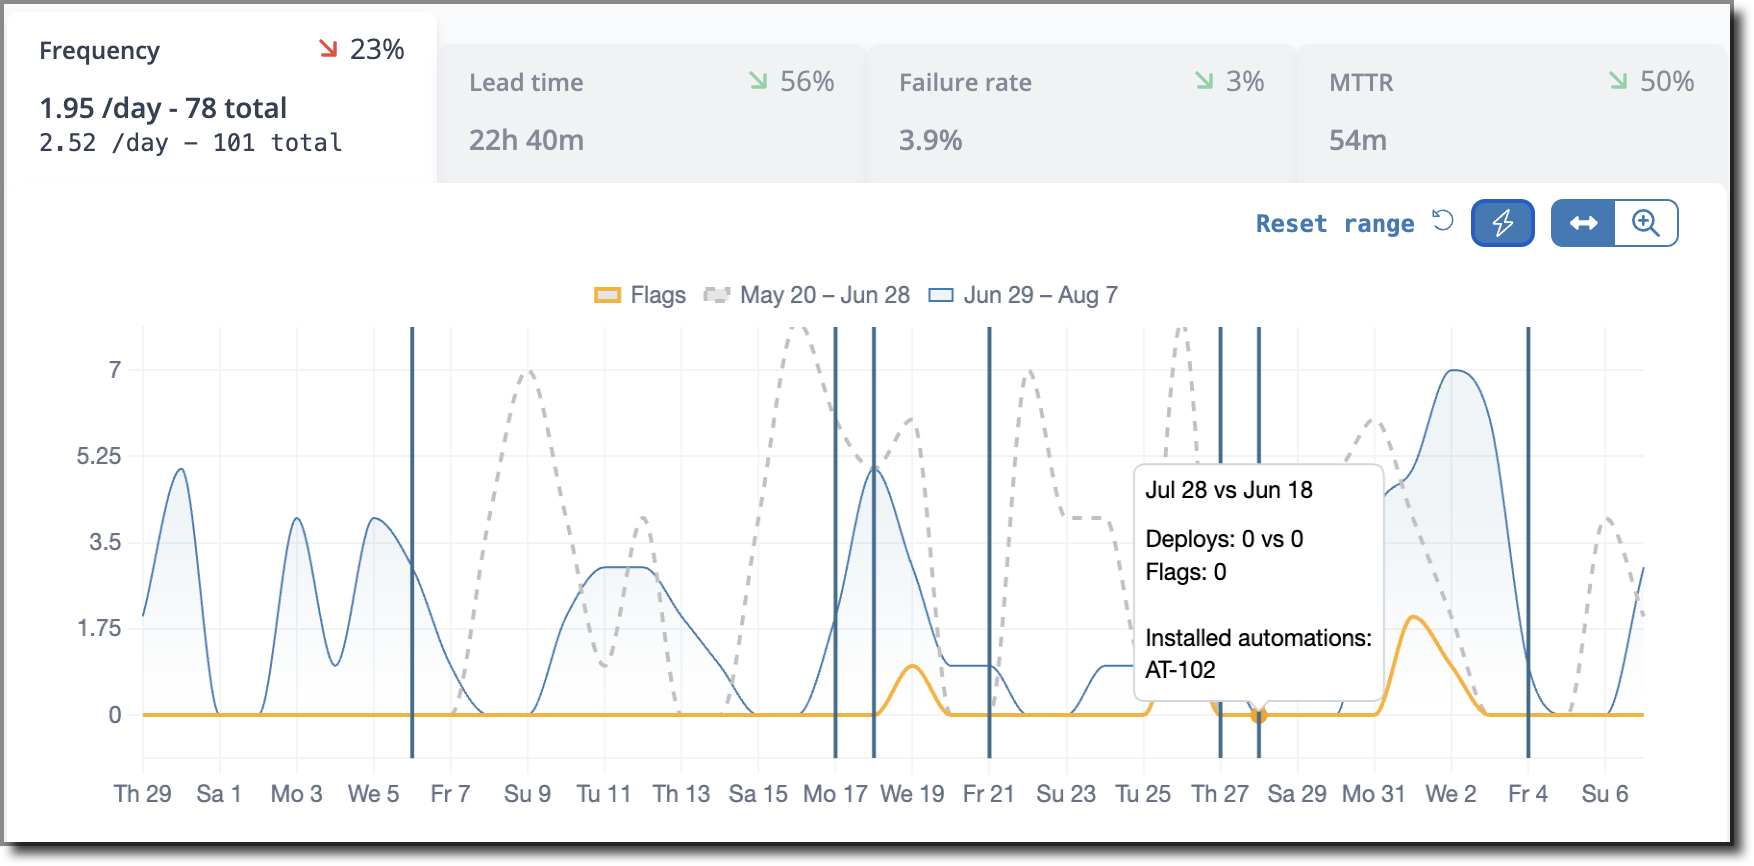
* The date range selection auto-updates to a period that starts from the earliest automation installation date and ends one week following the most recent installation (or the current date when it has been less than one week since the last automation was installed).
* The vertical lines on the chart represent the installation dates for installed automations. Hover over any vertical line to view the specific automation that was installed on that date. If multiple automations were installed on that date, they will all be referenced within the tool tip.
* To reset the date range back to your original selection, click **Reset range**
We're working on on adding much more granular visibility into the efficacy of individual automations, so stay tuned for more to come!