Sleuth Documentation
HomeBlogSupportSign up
  • Getting started
  • Navigating Sleuth
  • DORA metrics
    • Deploy frequency
    • Change lead time
    • Change failure rate
    • MTTR
    • Interpreting Metrics in Sleuth
  • Deployment tracking
    • Organization
      • Labels
      • Trends
      • Compare
      • Search
      • Status
    • Projects
      • Issue trackers
    • Environments
    • Code deployments
      • Creating a deployment
      • How to register a deploy
      • Rollbacks
      • Automatic tagging
      • Deployment locking
      • Environment drift
      • Move code deployments
      • Search everything
    • Feature flags
    • Manual changes
    • Deploys
    • Teams
  • Work in Progress
  • Goals
  • Sleuth Automations
    • Automations Marketplace
      • Installing Automations
        • Installing PR "Update" Automations
      • Editing and uninstalling Automations
      • Smart suggestions
      • Understanding efficacy
    • Custom Automations
      • Automations Cookbook
      • Webhook Actions
      • Trigger Build Actions
        • Bitbucket Pipelines
        • CircleCI
        • Github Actions
        • Jenkins
  • Slack & Email Notifications
  • Auto-verify deploys
    • Anomaly detection
    • Error impact
    • Metric impact
  • Ignoring pull requests
  • Slack mission control
    • Approvals
    • Project notifications
    • Personal notifications
    • Search Sleuth in Slack
    • Project/Deployment history
    • Developer standup
  • Sleuth API
    • Deploy Registration
    • Deploy import
    • Manual Change
    • Custom Incident Impact Registration
    • Custom Metric Impact Registration
    • Deprecation information
    • GraphQL Queries
    • GraphQL Mutations
    • Query batching
  • Integrations
    • About Integrations...
    • Code integrations (read-only)
      • Azure DevOps
      • Bitbucket
      • GitHub
      • GitLab
      • Custom Git
      • Terraform Cloud
    • Code integrations (write)
    • Feature flag integrations
      • LaunchDarkly
    • Impact integrations
      • Error trackers
        • Bugsnag
        • Honeybadger
        • Rollbar
        • Sentry
      • Metric trackers
        • AppDynamics
        • AWS CloudWatch
        • Custom
        • Datadog
        • Jira metrics (Cloud / Data Center)
        • NewRelic
        • SignalFx
      • Incident tracker integrations
        • Blameless
        • PagerDuty
        • Datadog Monitors
        • Statuspage
        • Opsgenie
        • Jira (Cloud/Data Center)
        • FireHydrant
        • Rootly
        • ServiceNow
        • Custom
          • Grafana OnCall
      • CI/CD builds
        • Azure Pipelines
        • Bitbucket Pipelines
        • Buildkite
        • CircleCI
        • GitHub Actions
        • GitLab CI/CD Pipelines
        • Jenkins
    • Sleuth DORA App for Slack
    • Microsoft Teams integration
    • CI/CD integrations
      • Azure Pipelines
      • Bitbucket Pipelines
      • Buildkite
      • CircleCI
      • Github Actions
      • GitLab CI/CD Pipelines
      • Jenkins
    • Issue tracker integrations
      • Jira Cloud
      • Jira Data Center
      • Linear
      • Shortcut
    • Fixing broken integrations
  • Pulse
    • Welcome to Pulse docs
    • Quick Start setup guide
    • Beginner tutorials
      • 1. How to create a Teamspace
      • 2. How to create a Review
      • 3. How to create a Survey
  • Features
    • Reviews
      • Review workflow
      • Review templates
      • Widgets and Sections
        • Widget type
      • Review settings
    • Surveys
      • Survey Workflow
    • Teamspaces
    • Inbox
    • AI assistant
    • General settings
      • Users and Teams
      • Investment mix
  • Settings
    • Organization settings
      • Details
      • Authentication
        • SAML 2.0 Setup
          • Okta Configuration
          • Azure AD Configuration
          • PingIdentity Configuration
      • Access Tokens
      • Members
      • Team Settings
      • Billing
    • Project settings
      • Details
      • Slack settings
      • Environment settings
      • Code deployment settings
      • Feature flag settings
      • Impact settings
    • Account settings
      • Account settings
      • Notifications settings
      • Identities settings
    • Role Based Access Control
  • Resources
    • FAQ
    • Sleuth TV
    • Purchasing
    • About Sleuth...
Powered by GitBook
On this page
  • Connect your Issue Tracker and Git tool
  • Create a Review
  • What next?

Was this helpful?

  1. Pulse

Quick Start setup guide

PreviousWelcome to Pulse docsNextBeginner tutorials

Last updated 1 month ago

Was this helpful?

This guide is for an administrator setting up Sleuth for the first time. It takes only 15 minutes as long as you have:

  • Jira admin API token (and email address)

  • GitHub admin access (with permission to install GitHub apps)

Don't use these tools? No problem! Sleuth supports lots of others, and you can find their prerequisites .

Connect your Issue Tracker and Git tool

Your issue tracker and Git repository give Sleuth most of what it needs to understand the work teams are doing, so start with these. Refer to for details on how to connect these and other integrations.

Create a Review

Create a test review to confirm that issues and pull requests are flowing into Sleuth.

  1. to Pulse.

  2. Click New review in the top-right corner of the home screen.
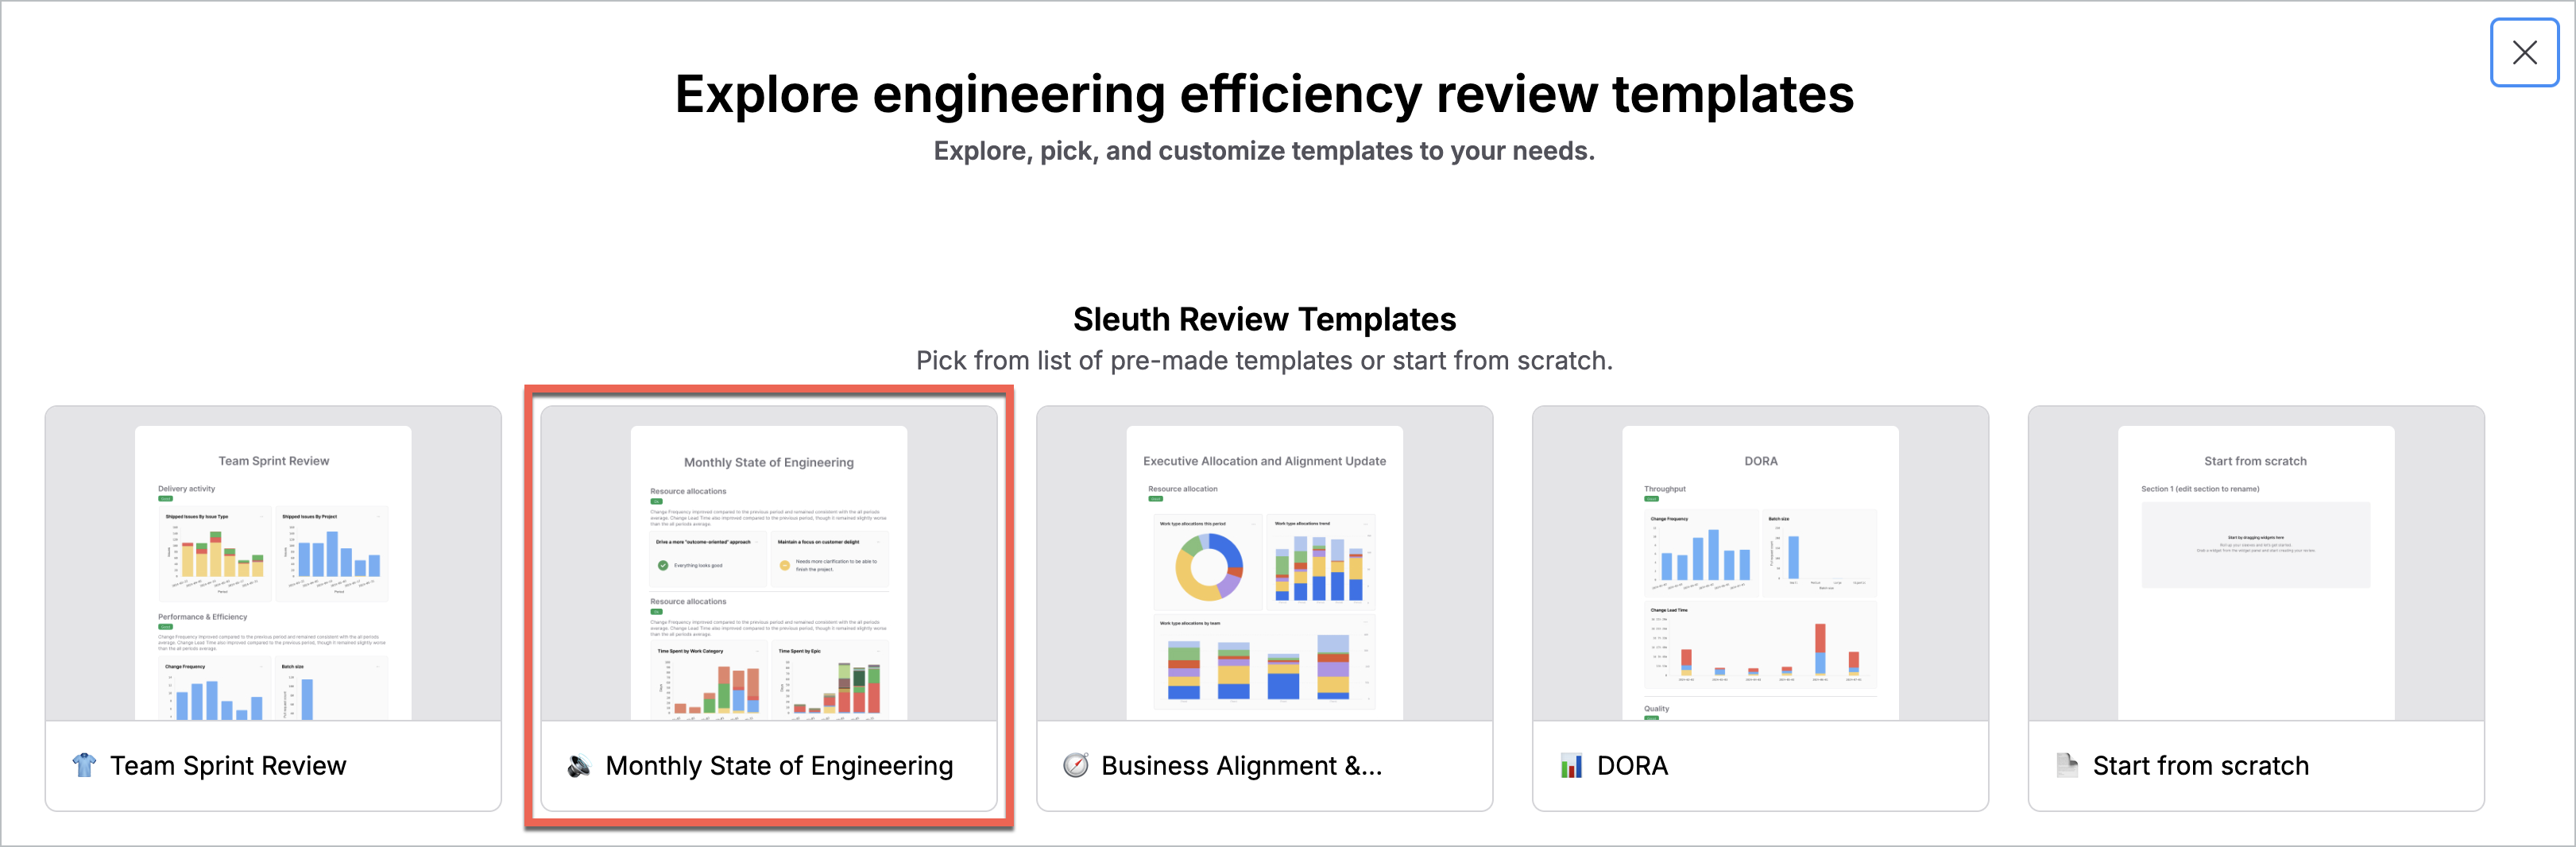
  3. Select the Monthly State of Engineering review template.

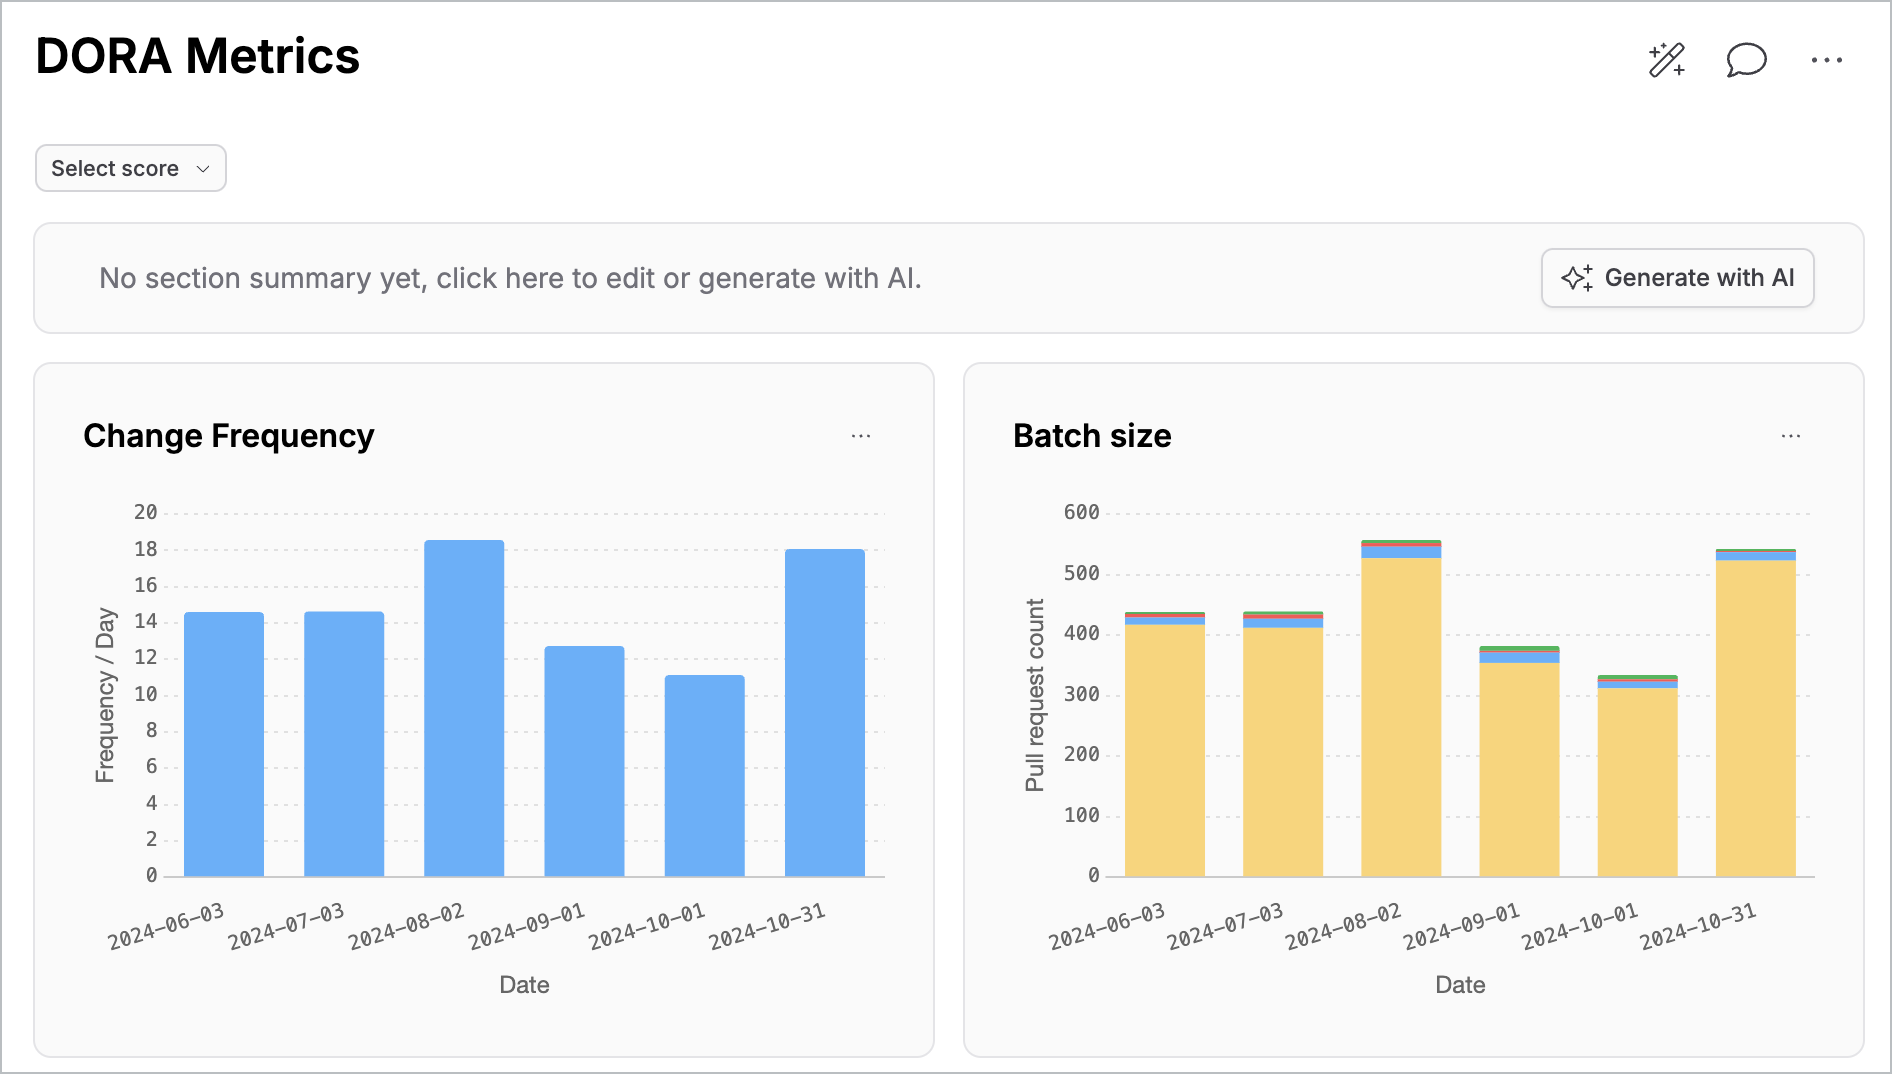
  4. Wait a few seconds for the review to load, then scroll down to the DORA section. If you see data in these widgets, then your pull requests are flowing into Sleuth.
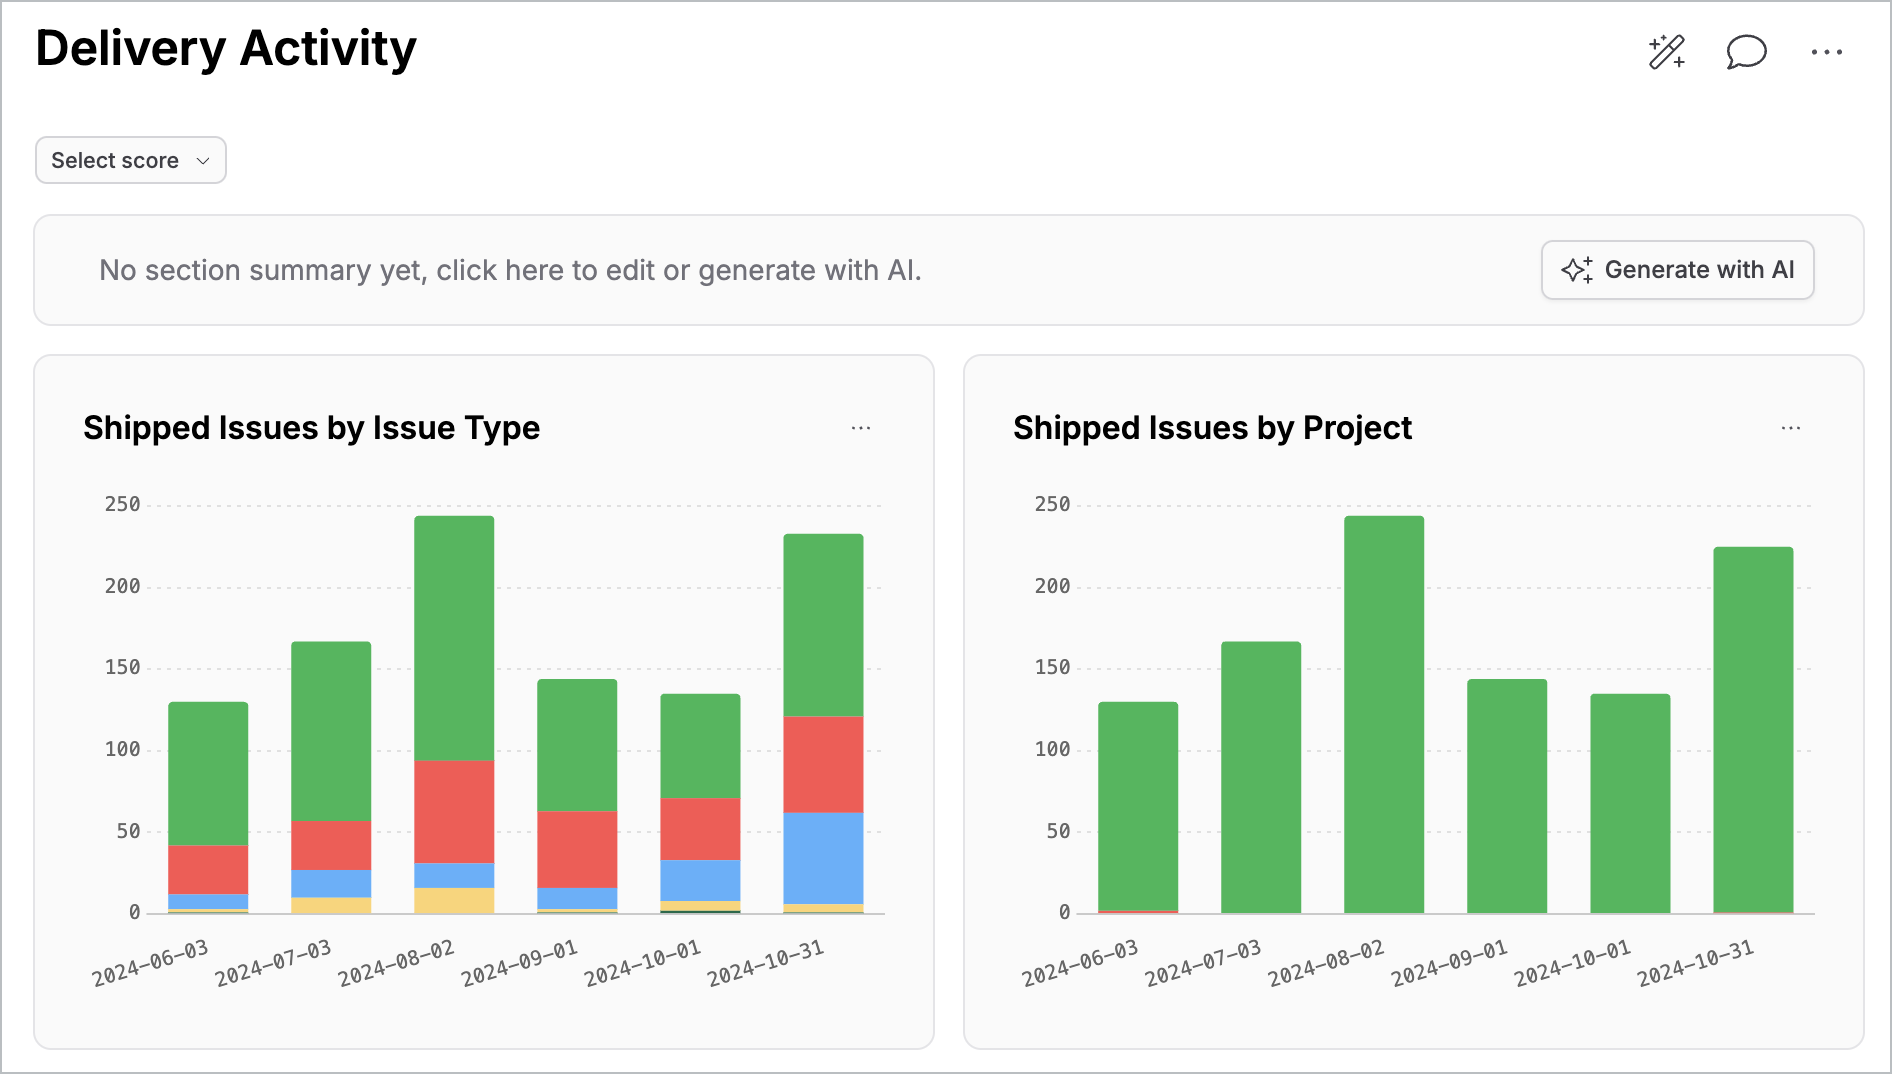
  5. Scroll down to the Delivery activity section of the review. If you see data in the widgets in this section, then your issues are flowing into Sleuth.

What next?

If the widgets in either of the sections above are empty, .

Depending on how you plan to roll out Sleuth, common next steps might be to connect , invite , or create .

contact support
Sign in
here
Integrations
Slack
users
Teamspaces